Platinum Cost Curves
In 2021, the total all-in sustaining costs per Pt eq. oz in ZAR terms decreased by 11.0%. The total all-in sustaining costs per Pt eq. oz in USD terms decreased by 0.9%, year-on-year, as the average Rand strengthened year-on-year. The decrease in equivalent costs is mainly due to an increase in 4E by-product prices (having a positive effect on Pt eq. oz) rather than lower operating costs. The ZAR denominated all-in sustaining costs per milled tonne increased by 24.8% year-on-year. The USD denominated all-in sustaining costs per milled tonne increased by 38.9% year-on-year.
October 2021 – Mining Right Application Process
We present an overview image of the process followed in terms of the MPRDA, NEMA and associated legislation for the application for a Mining Right (preceded by a Prospecting Right) and Environmental Authorisation in the Republic of South Africa. Minxcon is experienced...
September 2021 Platinum Cost Curves
In 2020, the total all-in sustaining costs per Pt. eq. oz in ZAR terms decreased by 10.1%. The total all-in sustaining costs per Pt. eq. oz in USD terms decreased by 21.3%, year-on-year, as the average Rand weakened significantly year-on-year. The decrease in...
November 2020 – Platinum Cost Curves
In 2019, the total all-in sustainable costs per Pt. eq. oz in ZAR terms, decreased by 11.7%. The total all-in sustaining costs per Pt. eq. oz in USD terms decreased by 18.9%, year-on-year, as the average Rand weakened significantly year-on-year. The decrease is mainly due to increase in 4E prices rather than lower operating costs. The total all-in sustainable costs per milled tonne increased by 12.6% year-on-year.
October 2020 – The Carbon Tax Act
Setting the Scene: What is Carbon Tax? Carbon tax is a carbon pricing instrument that is implemented in an advance to stimulate action to economic restructure by holding entities liable for environmental damage caused by the human caused emission of greenhouse gases...
December 2019 – Gold Cost Curves
In 2018, the total Rand all-in sustainable cost per ounce of gold produced in South African gold mines have risen by 14% year-on-year respectively, primarily as a result of increased labour and electricity costs, as well as operational...
November 2019 – Platinum Cost Curves
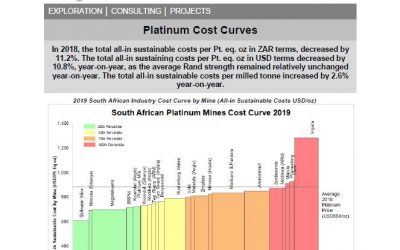
In 2018, the total all-in sustainable costs per PT. eq. oz in ZAR decreased by 11.2%. The total all-in sustaining costs per PT. eq. oz in USD terms decreased by 10.8%, year-on-year, as the average Rand strength remained relatively unchanged year-on-year....
October 2019 – Mining Productivity – PGE
Productivity influences the organisational performance of mining companies- Globally mining companies continue to face severe economic challenges. These global challenges also influence the South African mining industry and with additional...
April 2019 – Mining Productivity
2017 South African Gold Industry Tonnage Efficiency Curve by Mine (tonne per TEC)Globally mining companies are facing severe economic challenges. These global challenges also influence the South African mining industry and with...
January 2019 – Ore Transport
Notes: All-in Sustainable Cost (“AISC”) includes cash cost incurred at each processing stage, from mining through to recoverable metal delivered to market inclusive of royalties and production taxes, sustaining and reserve development capital...


